Soft knee and hard knee -- compression and overtones
I was talking with a friend about how a compressor/limiter/clipper can generate overtones to a wave. How does amplitude correspond to harmonics? I decided to write a short blogpost about it.
I'm modelling the compressor as kind of a waveshaper. What a waveshaper is doing is it maps the input amplitude (x axis) to a certain output amplitude (y axis). My model is the simplest of all. I want my channel to be of full range (the interval (-1, 1)), but I do not want my signal to be larger then these values, because then my ADC converter will have distortion effects. Then I have to use some kind of compression.
Our first model uses the clip function, that maps the input amplitude to +1 or -1 if they exceed that value. Another name for this phenomenon is saturation. Does it ring a bell? Let's see some examples! Here I collected some example values for easier understanding.
| input | output |
|---|---|
| -1.2 | -1.0 |
| -0.6 | -0.6 |
| 0.0 | 0.0 |
| 0.6 | 0.6 |
| 1.2 | 1.0 |
Our first subplot depicts this phenomenon. First, we see a sine wave with frequency 100Hz, (and angular frequency 2*pi*100 Hz). As we increase the input amplitude we can see that after applying the waveshaper ours signal looks more and more like a square wave. As we know squarewaves can be decomposed to an infinite number of sine waves . The square wave has quite a sudden change in amplitude making it hard, kind of impossible to approximate using continuous sine waves, only an infinite number of them is sufficient.
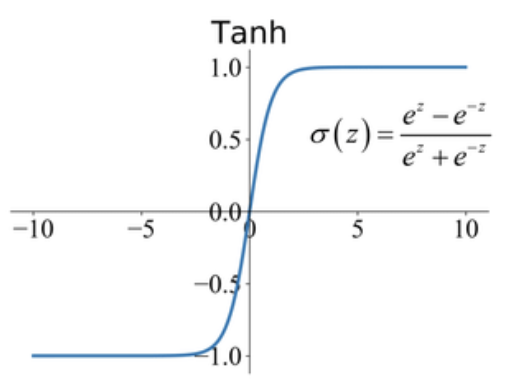
Our second model is a soft knee compression that I'm modelling with a tanh function. I collected some example values here, as well.
| input | output |
|---|---|
| -1.2 | -0.537050 |
| -0.6 | -0.291313 |
| 0.0 | 0.000000 |
| 0.6 | 0.291313 |
| 1.2 | 0.537050 |
This function maps the whole x axis to the range (-1, 1) but it never touches it, only at + or - infinity. It is also 'round', does not have any abrupt changes. The first subplot depicts such a function. After a while the function just saturates and wont allow any higher values. (Saturation. Does it ring a bell?)
The second subplot depicts what happens when I increase the volume of the sine wave and apply the compression. One can see that the sines get rounder but they never exceed + or - 1. They also have less frequency content because of the roundness of the waveshaper.
Don't forget to listen how they sound below!
And finally you can listen to the sound here in this video.
The conclusion is that the more abruptly you change your wave the more overtones you get. When you analyze your sound with the Fourier transform you get more components, because the sound is getting more and more complex. The more complex the sound the more components resulting in a richer overtone series. This is way the how the [amplitude, compression, waveshape ] relates to [freqency components, overtones, harmonic content].
Cheers!


